Ken You Data?
Welcome to my blog "Ken You Data?" Join me as I dive into data topics ranging from extracting, cleaning, visualizations, machine learning, statistics, and more. Learn and grow with me, but I must ask one question: Ken you Data?
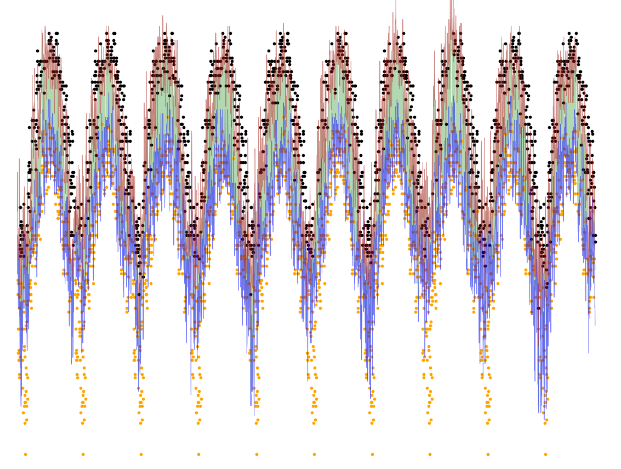
Temperature data from a weather station in Michigan is shown above varying by day over a span of years. The temperature is separated into red, green, and blue bands for high, medium, and low temperatures of that day respectively. We can see the sinusoidal pattern (the rise and fall) reflecting the seasonality of the data which is to be expected. Given all these years of data we took the subsequent year and mapped its upper and lower extremes as black and orange dots respectively to see if it exceeded the prior years. These extremes exceeded those of prior years showing a spreading of temperature data.